Six agents, one real signal
I gave a team of AI agents one real demand signal from an Australian supermarket and asked them to work a supply chain exception end to end. Here is what was real, what was simulated, and what I learnt.
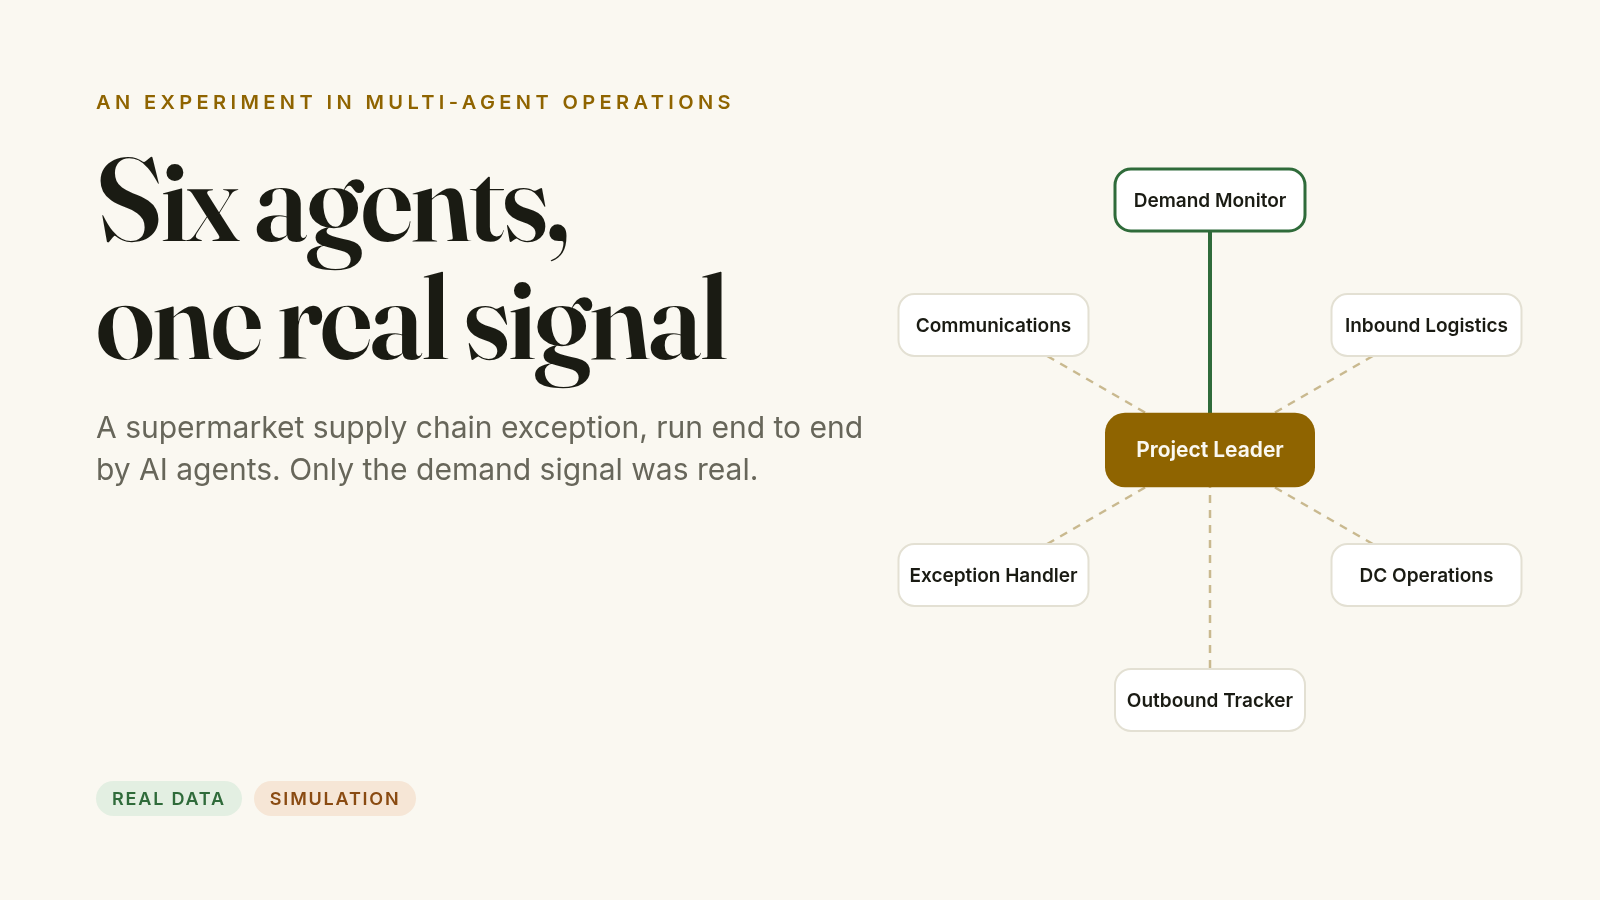
Most conversations about agentic AI in retail still happen on whiteboards. A box labelled “agent”, an arrow, another box, and a confident claim that the whole thing will run itself.
I wanted to see what it looks like when you actually press go.
So I ran an experiment. I took one real demand signal from a major Australian supermarket, handed it to a team of AI agents, and asked them to work a supply chain exception from detection to decision. The whole run came back in about five minutes. It was impressive, a little unsettling, and more honest about its own limits than I expected.
Here is what happened, what was real, and what was not.
The brief
I wrote one brief. Six specialist agents, plus a Project Leader agent in the middle to route work, ask questions and approve decisions.
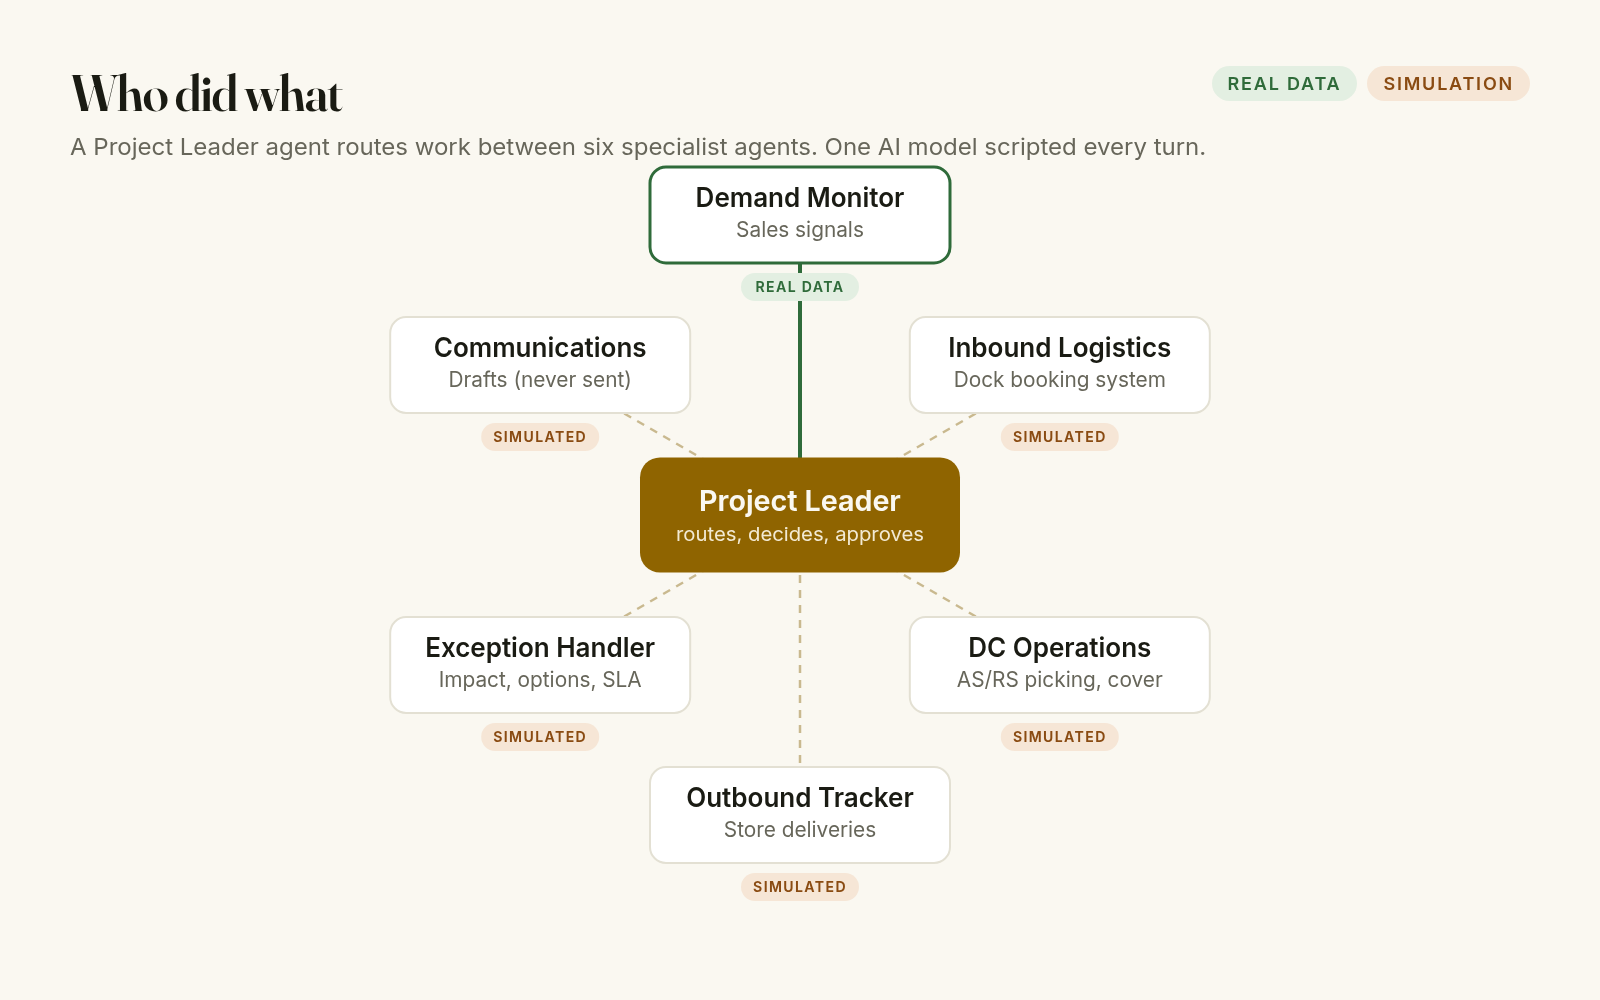
| Agent | What it owns |
|---|---|
| Project Leader | Runs the cycle, routes requests, approves or rejects options |
| Demand Monitor | Reads sales signals and raises replenishment |
| Inbound Logistics | Inbound POs, the dock booking system, freight forwarder ETAs |
| DC Operations | Stock cover across two automated DCs, the AS/RS picking system |
| Outbound Tracker | Store delivery schedules and the 3PL partner’s linehaul |
| Exception Handler | Impact, options, SLA breaches, the exception ticket |
| Communications | Drafts messages to the forwarder and the 3PL partner |
The rules were simple. Every agent works through the Project Leader, every step is timestamped, and every number has to say where it came from.
One thing I want to be upfront about. This was not six independent systems negotiating with each other. One AI model played every role in a scripted run. That is fine for an experiment, and it is the first thing a sceptical executive will ask, so I would rather say it here.
Real signal, simulated operation
The only data I had access to was sales. No stock on hand, no purchase orders, no dock bookings, no carrier feeds.
That shaped everything. The Demand Monitor worked on real, anonymised daily sales. Everything after that, the stock levels, the container, the dock slot, the ETAs and the costs, was simulated so the rest of the team had something to work against.
Even the real data had caveats, and the agent called them out itself. The “current week” turned out to be a few weeks old. Order quantities were empty, so it used sales value instead of units. The operational zone field was mostly blank, so it fell back to the store’s state. A national comparison did not reconcile, so it flagged that as directional only.
None of that is unusual in a first pass at someone’s data. What mattered is that it was written down rather than smoothed over.
The run, minute by minute
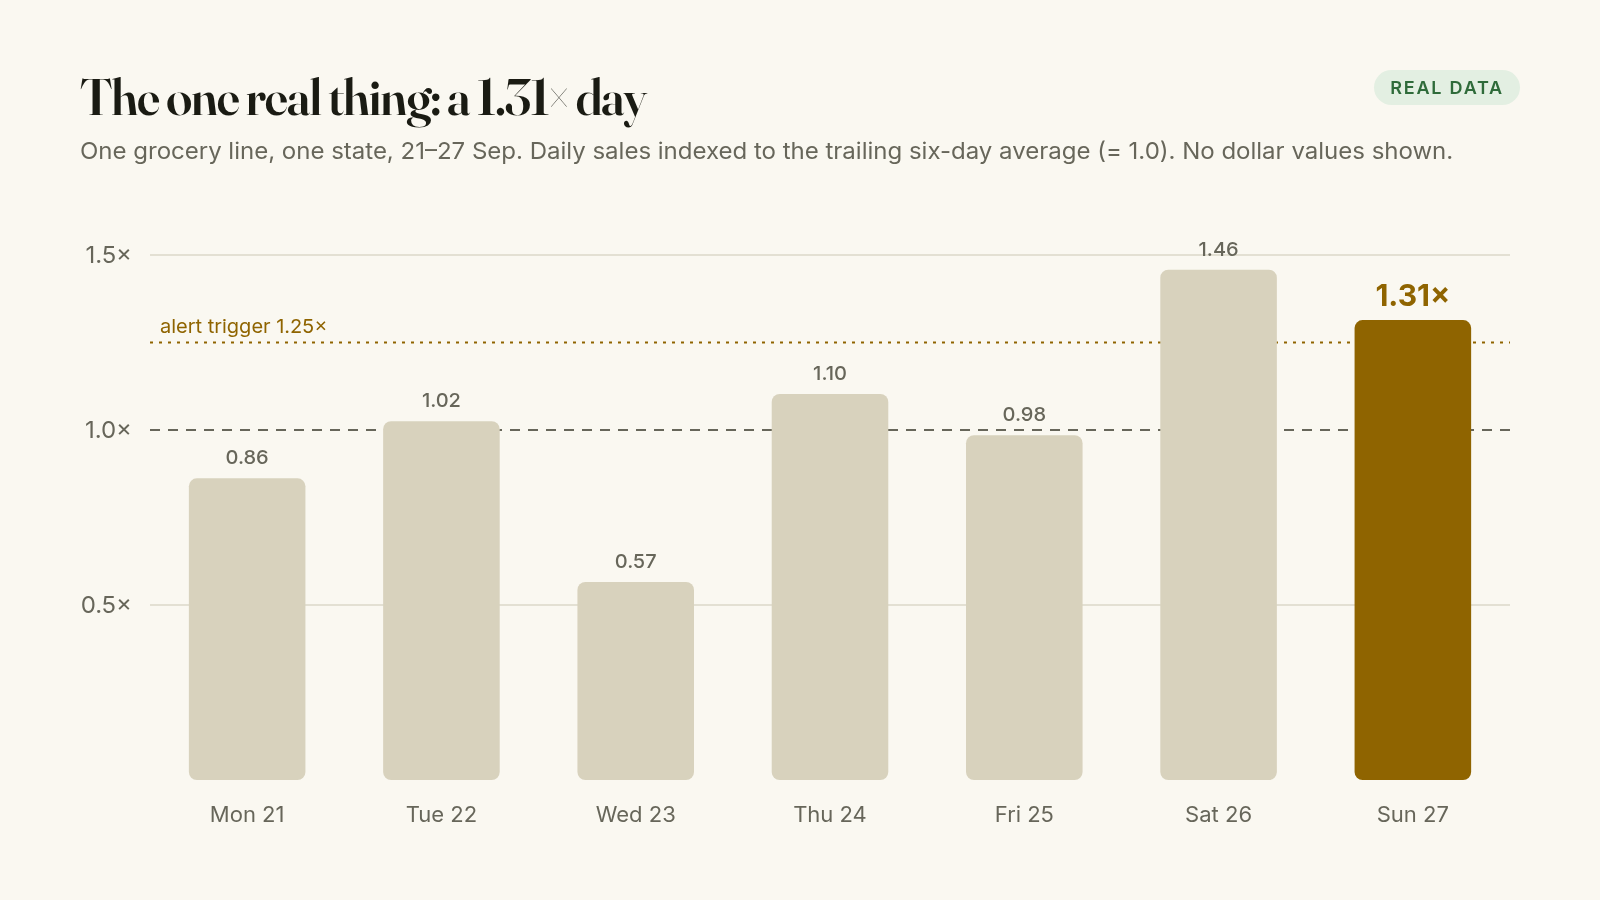
The trigger was one grocery line in one state. On the latest day it sold at 1.31× its trailing six-day average, above the 1.25× alert threshold. Saturday had been even higher. One Queensland zone ran at 1.51×. Of the 12 stores carrying the line, a regional cluster of three made up 44% of the day.
That was the last real number. From here on, everything is simulated.
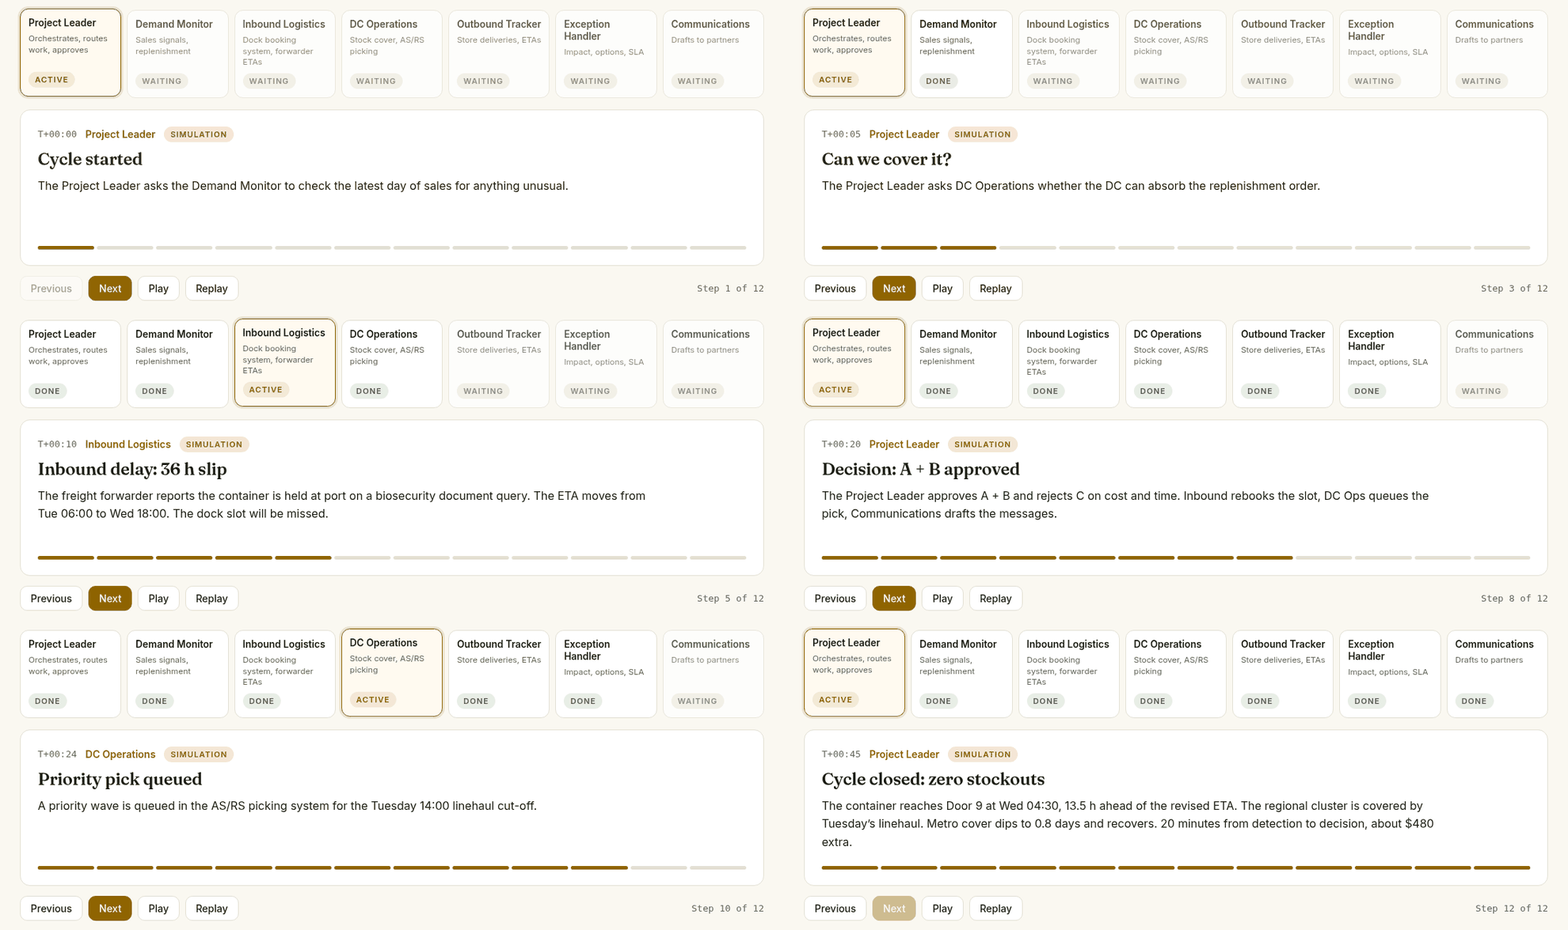
- T+00:00. The Project Leader starts the cycle and asks the Demand Monitor to check the latest day.
- T+00:02. The Demand Monitor flags the spike and raises a 420-case replenishment order. Real signal, simulated order.
- T+00:07. DC Operations reports 3.1 days of cover, falling to 1.0 day once that order ships. The rest of the week depends on one inbound container booked into a Tuesday morning dock slot.
- T+00:10. Inbound Logistics hears from the freight forwarder. The container is held at port on a biosecurity document query, the ETA slips 36 hours, and the dock slot will be missed.
- T+00:15. The Outbound Tracker maps the impact. Regional linehaul only runs three days a week. Without that container, six stores (the regional cluster plus one more) run out from Thursday midday. Metro is fine until Friday.
- T+00:18. The Exception Handler opens a HIGH ticket: a 36-hour slip against a 12-hour SLA. Three options. A priority pick onto Tuesday’s linehaul. An alternative carrier to collect the container the moment it clears, recovering 14 hours for about $480. Or an inter-DC transfer, slower and roughly four times the cost. It recommends the first two together.
- T+00:20. The Project Leader approves both and rejects the transfer.
- T+00:22 to T+00:26. Inbound rebooks the dock slot, DC Operations queues the priority pick in the AS/RS picking system, and Communications drafts notes to the forwarder and the 3PL partner. Drafts only. Nothing was sent to anyone.
- T+00:45. Cycle closed. In the simulation the container lands 13.5 hours ahead of the revised ETA, the regional stores are covered, and metro cover dips but holds.
The simulated scorecard: six stores at risk down to zero, zone on-shelf availability from roughly 91% to roughly 99%, about $480 in extra freight, and 20 minutes from detection to decision. Those are simulated KPIs, not measured results.
You can step through the whole thing in the interactive playback. Every step is tagged real data or simulation.
The moment I trusted it more
The most useful moment in the run was not the decision. It was a correction.
On its first pass, the Demand Monitor reported the spike as 1.50×. Then it noticed something was off. The data layer was returning several rows per group and quietly ignoring filters on columns that were not grouped. So the agent grouped first, re-summed, and cross-checked the daily totals against store-level figures.
The real number was 1.31×. It replaced its own headline and explained why.
A 1.50× spike and a 1.31× spike can call for very different responses. If the first number had flowed straight into a replenishment order, every agent downstream would have acted confidently on the wrong figure.
That is the part that won me over. Not that the agent got it right first time, but that it checked its own work, said so, and showed the method.
What I’d tell another practitioner
Your data sets the ceiling. The agents were only ever as real as their inputs. With sales data alone, one agent out of six could work on reality and the other five were theatre. If you want to know how far agents can go in your operation, start by mapping which of these roles you could feed with live data today. That list is your real roadmap.
Label real versus simulated, everywhere. When I turned this run into a page for executives, the design choice that mattered most was a tag on every step: real data or simulation. It sounds minor. It is the difference between a demo people trust and a demo people quietly discount. Executives can handle “this part is simulated”. What they cannot handle is finding out later.
Decide who decides. In this run the Project Leader approved spend on its own. Small, sensible spend, but spend. In a real operation I would want that line drawn before anything goes live: which decisions an agent can take, which need a human, and which need a human plus a written reason. I wrote more about that in Who decides when the system acts, and it is also the question behind The future of retail.
The whiteboard version of agentic AI skips all three. The real version is mostly made of them.
~ Mr. Gómez